How to get Actual Execution Plan for specific query and not to destroy your server
One of the techniques for query performance troubleshooting is to compare Actual and Estimated Execution Plans. In the most cases, both plan shapes are identical and the only difference is in the runtime statistics (ActualNumberOfRows, ActualExecution, MemoryGrant, DegreeOfParallelism etc.) – those are present in Actual Execution Plan only. If the difference between estimated and actual number of rows is too big, you have a cardinality estimates issue.
For demonstration, let’s enlarge AdventureWorks2017 sample database using J. Kehayias script (you can download it here).
You can obtain graphical Actual Execution Plan by one of the following options:
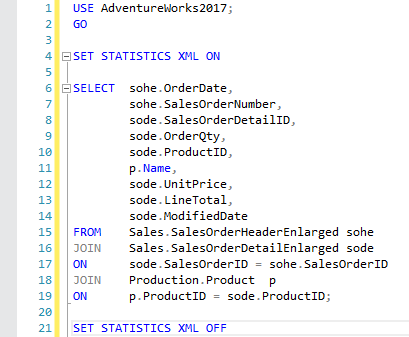
1. SET STATISTICS XML
If you use this command before your actual query, you will get XML representation of Actual Execution Plan:
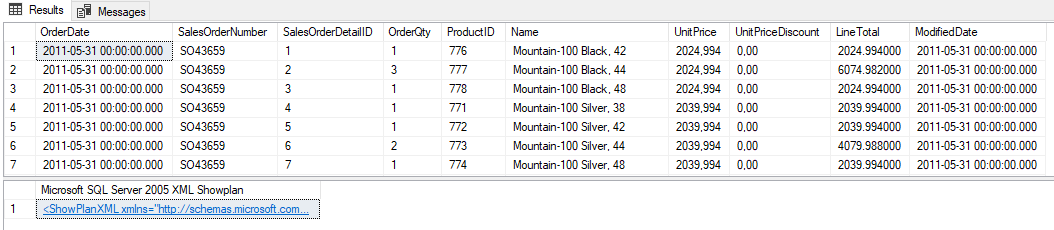
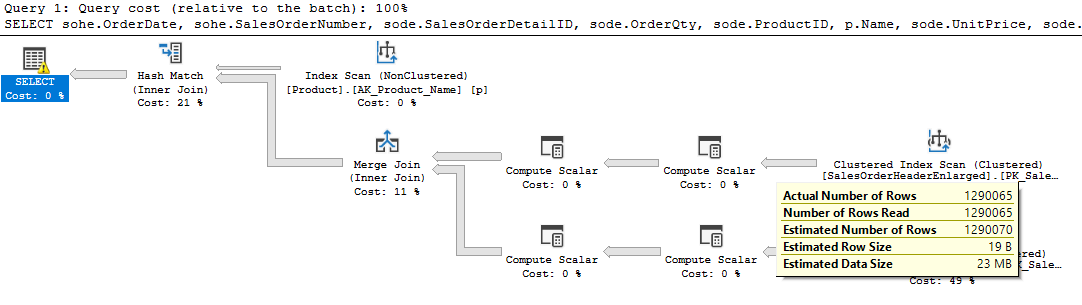
Actual Execution Plan can be displayed in SQL Server Management Studio by clicking on the link below the result:
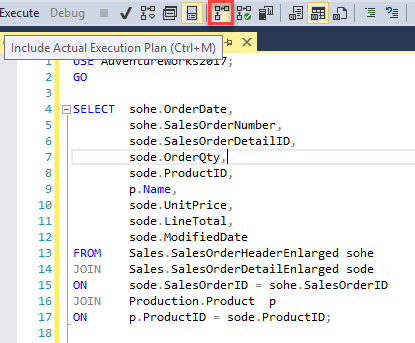
2. SQL Server Management Studio
You can include Actual Execution Plan in the result if you click on Include Actual Execution Plan button in SSMS before you run your query:
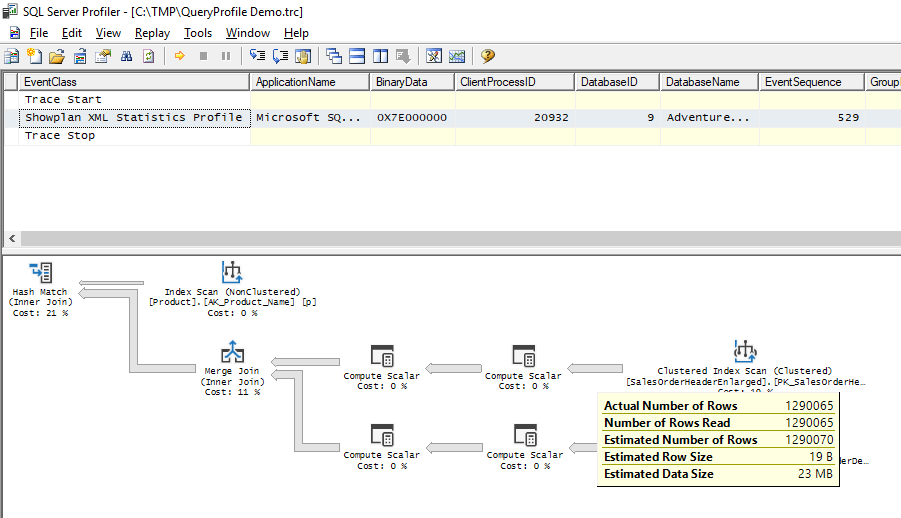
3. SQL Server Trace/Profiler
For those who love SQL Server Trace/Profiler, Showplan XML Statistics Profile event is available to capture Actual Execution Plan:
4. Extended Events - legacy infraštruktúra
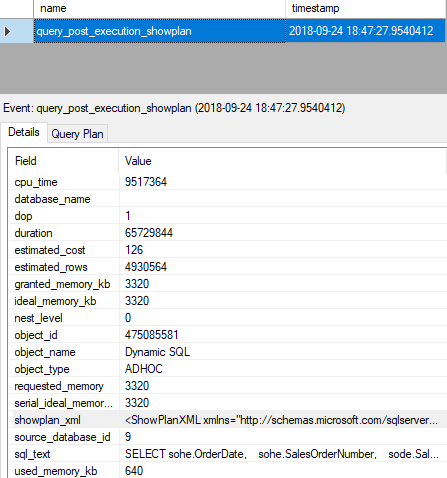
For Extended Events fans there is query_post_execution_plan event available for acquiring Actual Execution Plan:
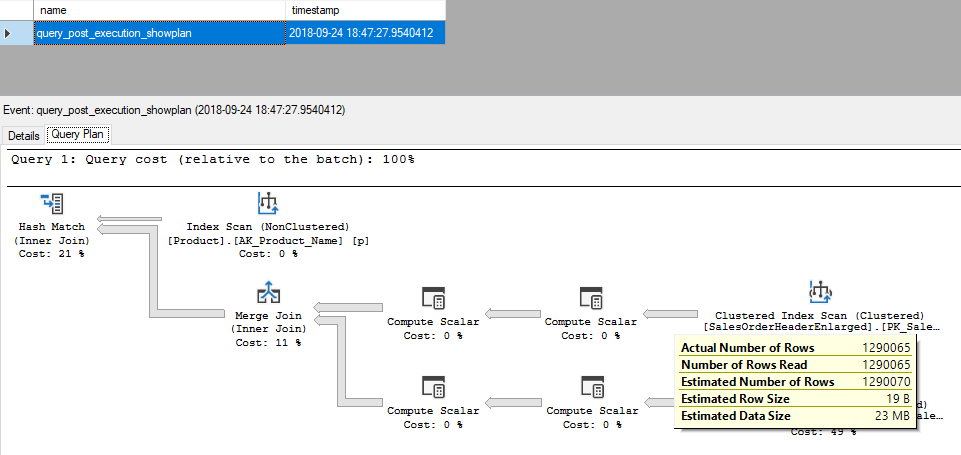
You can see graphical Actual Execution Plan in QueryPlan tab:
Now you can see the disadvantage of the first and the second option – both of them require some activity before actual query is run. Therefore, capturing of Actual Execution Plan by using any of these two options is more suitable for developers and testers.
The third and the fourth option have their own disadvantages as well:
1. High performance overhead
Both methods have significant performance overhead up to 75%.
2. Insufficient granularity
It’s not possible to get Actual Execution Plan for one query without evaluating every query running on the server.
The disadvantages mentioned above make query profiling by using legacy infrastructure on the servers with high production workload impossible. In reality, we often need to profile heavily loaded production servers, but how to get Actual Execution Plan of specific query and not to destroy server?
The problem with performance overhead of legacy infrastructure was solved in SQL Server 2016 SP1 by introducing lightweight infrastructure for query profiling. This infrastructure creates minimal performance overhead on monitored servers – just up to 2% (according to Microsoft). It’s disabled by default (in SQL Server 2016/2017) and it can be enabled by using global trace flag 7412 or by query_thread_profile extended event.
Now we have got rid of the performance overhead, but we still have a problem with insufficient granularity. This means that we are still unable to get Actual Execution Plan for specific query without evaluating every query running on the system. This problem is solved in SQL Server 2016 SP2 CU3/2017 CU11/2019 with the new query hint argument - QUERY_PLAN_PROFILE. This argument enables lightweight infrastructure only for queries which are using this hint. How does it work?
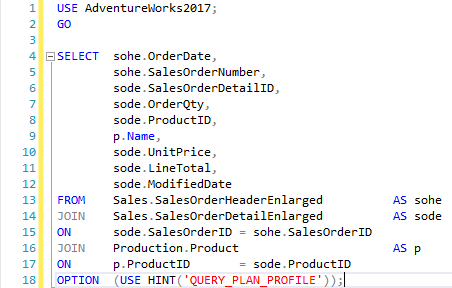
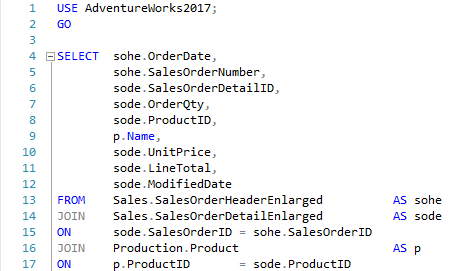
First of all, you have to modify query you want to profile by adding query hint with QUERY_PLAN_PROFILE argument:
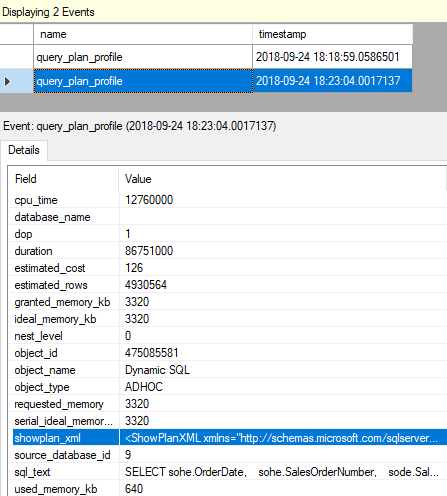
The next step is to prepare and start extended event session with query_plan_profile event, which will contain Actual Execution Plan. Run the query and when the query will be finished, query_plan_profile event will appear in your extended event session.
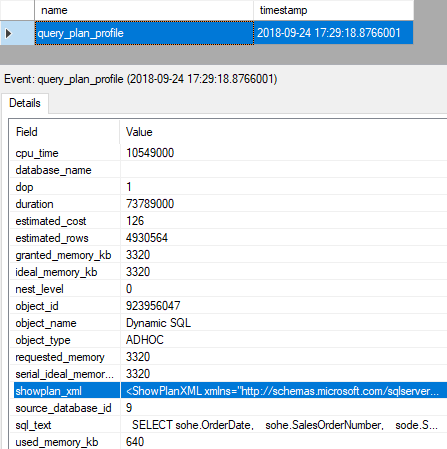
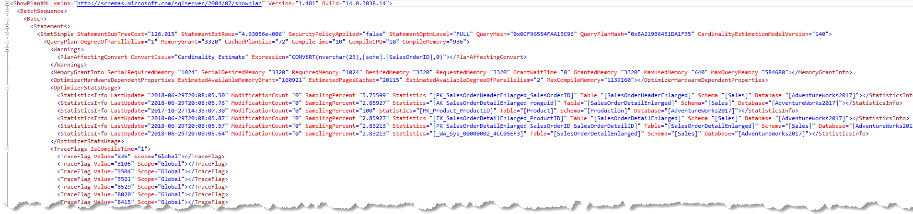
When you will click on the showplan_xml attribute, you will see a XML representation of Actual Execution Plan. In this case Query Plan tab isn’t available, therefore you have to copy the plan into SSMS or into SentryOne’s Plan Explorer:
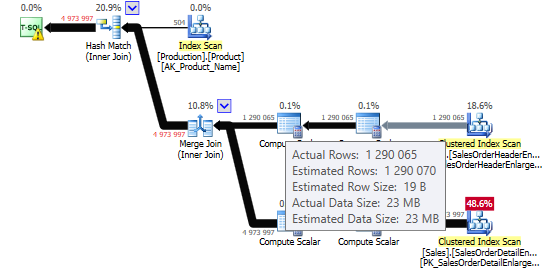
Now we can view graphical Actual Execution Plan:
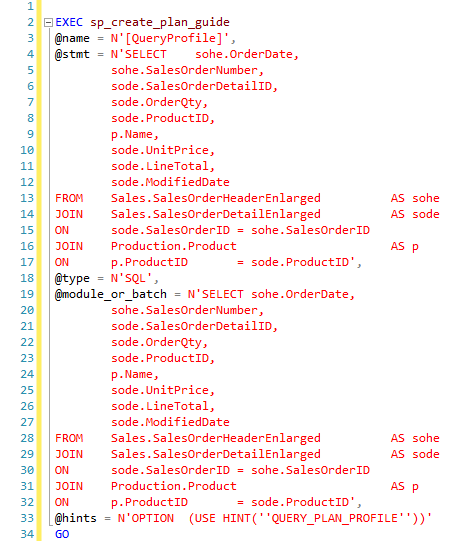
As you can imagine, this approach also has it’s disadvantage – query modification in application. I’m pretty sure that most of you don’t have the means to modify code in the production system because of query profiling. In this case, Plan Guides can save our lives and by using this feature you can add query hint to the specific query without modifying the source code:
Let’s run the query again, now without the query hint:
Here is the result:
QUERY_PLAN_PROFILE is really useful hint, which will make life of many DBA solving production problems much easier ?
Thanks for reading